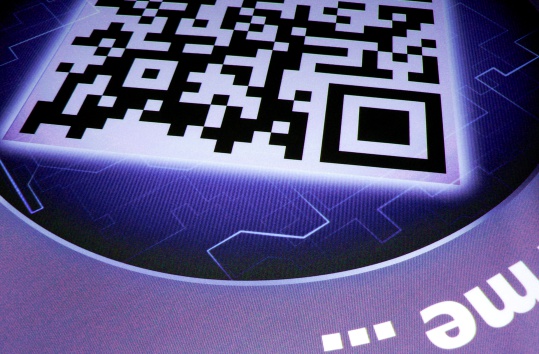
The number of mobile action codes--such as Quick Response (QR) codes, image recognition (IR) and invisible watermarks applied to photographs, brand logos and icons -- appearing in the top 100 circulating U.S. magazines continues to grow dramatically, reports mobile engagement services company, Nellymoser.
The company's annual Mobile Activation Study records instances in which a printed magazine page is capable of being activated by a mobile device, such as a smart phone or tablet. In addition to a steady growth in the mobile activated space, 2013 also saw a rise in the range of technologies used to deliver activations.
Findings:
MOBILE ACTION CODES APPEARING IN MAGS JUMP 55%
Compared to a total of 8,448 mobile activated magazine pages (advertising and editorial content) in 2012, 2013 saw the number of mobile experiences in the top 100 magazines rise to 13,088 -- a 55% growth.
EDITORAL CONTENT TAKES OFF AS A DRIVER OF ACTION CODE USE, ESPECIALLY IMAGE RECOGNITION (IR)
Editorial content mobile activations increased 246% from 2012 to 2013 (from 1,486 in 2012 to 7,972 in 2013). As reported in the study, "This is due primarily to editorial’s embrace of technologies that are unobtrusive to the overall look of the page’s layout— including image recognition (IR) and digital watermarking—in addition to augmented reality (AR) experiences."
IMAGE RECOGNITION (IR) USE SURPASSES QR CODES IN A BIG WAY
The primary activation type overall was Image Recognition (IR), followed by QR—taking second place for the first time in the scope of the study, and watermarking in third.
Image Recognition (IR), which includes Augmented Reality (AR), comprised 6.1% of all triggers in 2012; in 2013, there were 7,916 pages that were activated using the technology, representing 60% of all triggers (advertising and editorial) -- a ten-fold increase. Image-based activations do not require any change in the image itself or the pre-production process, as other mobile action codes do.
Compared to a total of 5,780 in 2012, the number of QR codes deployed in 2013 fell to 3,123 -- marking a reduction from 68% in 2012 to 24% in 2013.
Digital watermarks reached 12% of total market share, an increase from 6% in 2012.
ADVERTISERS REMAIN HEAVY USERS OF QR CODES
Advertisers remain heavy users of QR code campaigns -- the trigger comprised 60% of all advertising activations. The study states, "QR is a common choice for single page ad campaigns as its distinctive appearance makes it highly noticeable, and its long tenure in the market makes it recognizable to the reader. In addition, the likelihood of readers already having an app that scans QR codes on their devices is greater than that of newer technologies, making it a more attractive choice to advertisers."
TYPES OF MAGAZINES DEPLOYING MOBILE ACTIVATION
The most mobile activation represented segments were Fashion & Style (3,893) and Lifestyle & Leisure (3,196) followed by Home & Gardening (855), Home & Cooking (816), Entertainment & TV (750), and Fashion & Beauty (704).
THE USER EXPERIENCE, IMPROVING?
Post-scan experiences (what happens after the reader activates content with their phone) appear to be improving, states Nellymoser, with a focus on providing more value to consumers -- though the majority of scans still take the consumer to a web site landing page.
-----------------------------------------------
About: The list of investigated magazines was selected based on circulation statistics released by the Magazine Publishers Association (MPA) and included monthly, weekly, and biweekly publications. Freely distributed and membership-based publications were excluded. Regional titles, as well as those not readily available on newsstands were also omitted.
Tens of thousands of pages were examined in search of mobile programs or activations, whether triggered by QR code, Microsoft Tag, digital watermarking, image recognition (IR), SMS code, or any other activation triggers. This study not only measures the presence of mobile activation in magazines, but also what it delivers to the reader, how it connects, and what the overall user experience looks like.
Source: Nellymoser, Mobile Activation Study Jan-Dec, 2013, accessed Feb. 19, 2014.


